








Forex trading often relies on the analysis of technical indicators. Technical indicators use statistical methods to analyze historical price data in order to predict future price trends. This article will introduce three commonly used technical indicators—MACD, KDJ, and RSI—to help investors better predict forex price movements.
I. The MACD Technical Indicator
1. Introduction to the MACD Indicator
MACD, which stands for Moving Average Convergence Divergence, is a technical indicator that reflects currency price trends by utilizing the crossover and divergence of a fast moving average and a slow moving average, along with double smoothing and double calculations.
Typically, 12 days and 26 days are set as the fast moving average (EMA(12)) and the slow moving average (EMA(26)), respectively, from which the difference (DIF) and the average of the difference (DEA) are calculated.However, in actual trading, there is no need to calculate these values manually; you can simply set the parameters directly in your trading software.

2. Practical Analysis of the MACD Indicator
The MACD can be used to analyze and forecast the EUR/USD price movement in May 2022.As shown in the chart below, after a prolonged downtrend in the euro exchange rate, the MACD indicator shows negative values for both the DIF and DEA lines. When the DIF crosses above the DEA—known as a “golden cross”—a buy position should be taken at 1.0349; when the DIF crosses below the DEA—known as a “death cross”—a sell position should be taken.

II. KDJ Technical Indicator
1. Introduction to the KDJ Indicator
The KDJ is a stochastic indicator used to analyze the relationship between the day’s closing price and the highest and lowest prices over a specific period, thereby assessing the strength of the market. The K, D, and J values are represented by three separate curves; their calculation is relatively complex, but you can configure the parameters yourself within your trading software.

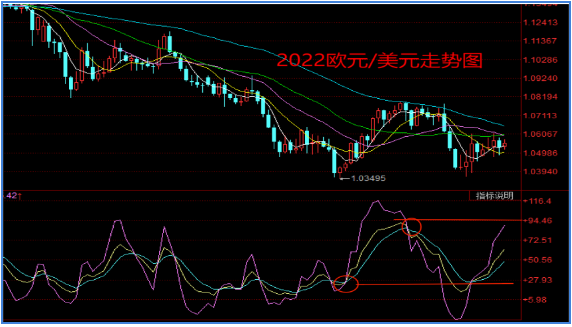
2. Practical Analysis of the KDJ Indicator
The price movement of the EUR/USD pair in May 2022 is shown in the chart below. When the KDJ value is around 27, the market is oversold, indicating a good buying opportunity; when the KDJ value is around 94, the market is overbought, indicating a good selling opportunity. You can also use the golden cross and death cross patterns formed by the fast and slow lines of the KDJ indicator to determine whether to buy or sell.
III. The RSI Technical Indicator
1. Introduction to the RSI Indicator
The Relative Strength Index (RSI) assesses market price trends based on the strength of supply and demand. It uses the average of price movements over a specific period as a measure of the relative strength of buyers and sellers, and uses this to predict future price movements. Its parameters are typically set to 6 days, 12 days, and 24 days.

2. Practical Analysis of the RSI Indicator
The AUD/USD exchange rate trend in May 2022, as shown in the figure below, indicates that on May 12, the RSI indicator was below 50, indicating an oversold condition. Combined with the golden cross signal from the KDJ indicator, this can be identified as the optimal buying opportunity.On June 3, the RSI indicator approached 80, indicating an overbought condition. Combined with the death cross signal from the KDJ indicator, this suggested that it was time to sell.

Therefore, when analyzing a particular technical indicator, it is not done in isolation but is often part of a comprehensive analysis that combines multiple indicators.
Want to build a forex platform? Start a forex brokerage?
Are your MT4 and MT5 applications repeatedly being rejected? Choose Sirix-Venture’s low-cost solution with cutting-edge technology:
Sirix White Label + LxFeed + CRM + Website—avoid MT4 and MT5 rejection, enjoy a simpler, more intuitive interface, lower prices, and greater control.