

Last updated: November 2026
Trader lifetime value is the net revenue a brokerage or prop firm earns from one trader across the whole relationship, minus the cost of serving that trader. You measure it by cohort, using trading revenue rather than deposits, and you compare it with what you paid to acquire the client. Get the measure right and decisions on marketing spend, retention and pricing get much easier.
Many brokers still judge campaigns on first-time deposits. That number tells you who arrived, not who stayed or what they were worth. As Finance Magnates argues in its piece on trader LTV as a development process, client value builds over time rather than being captured at signup. This guide gives marketing, retention and dealing teams a working model: a formula that fits your revenue model, a cohort method that filters out market noise, the early signals that predict value, and a way to turn it into budget decisions.
What Trader LTV Actually Measures
Trader LTV is the total net revenue a trader generates for the business over their active life, after the direct costs of serving them and before acquisition cost. Keeping acquisition cost out of the figure matters. LTV and CAC are two separate numbers, and you learn the most by comparing them, not by blending them into one.
The common shortcut is to use net deposits as a proxy. It is easy to pull from the back office, but it misleads. Deposits are client money, not revenue. A trader who deposits heavily but rarely trades may earn the business very little, while a small, active account can produce steady revenue for years. Net deposits are a useful check on funding flows, but they belong next to revenue, not in place of it.
The same caution applies to first time depositor value. What an FTD looks like on day one is only a starting point. For broker unit economics, what counts is how that value develops over the following months.
Scale your brokerage today!
CRM & Client Portal, Trading Platform, MT4 & MT5 - All built for you.
Scale NowHow to Calculate Trader Lifetime Value
The calculation has five steps, and each uses data most brokerages already hold.
- Define the cohort. Group traders by the month of their first deposit.
- Measure lifespan. Track how many months each cohort keeps trading.
- Count active days. Record the average number of days per month on which a trader opens or closes a position.
- Calculate revenue per active day. Divide the cohort's trading revenue by its total active days.
- Subtract cost to serve. Deduct direct costs that scale with the account, such as payment processing, partner payouts and per-account platform fees.
The core formula
Put together, the model reads:
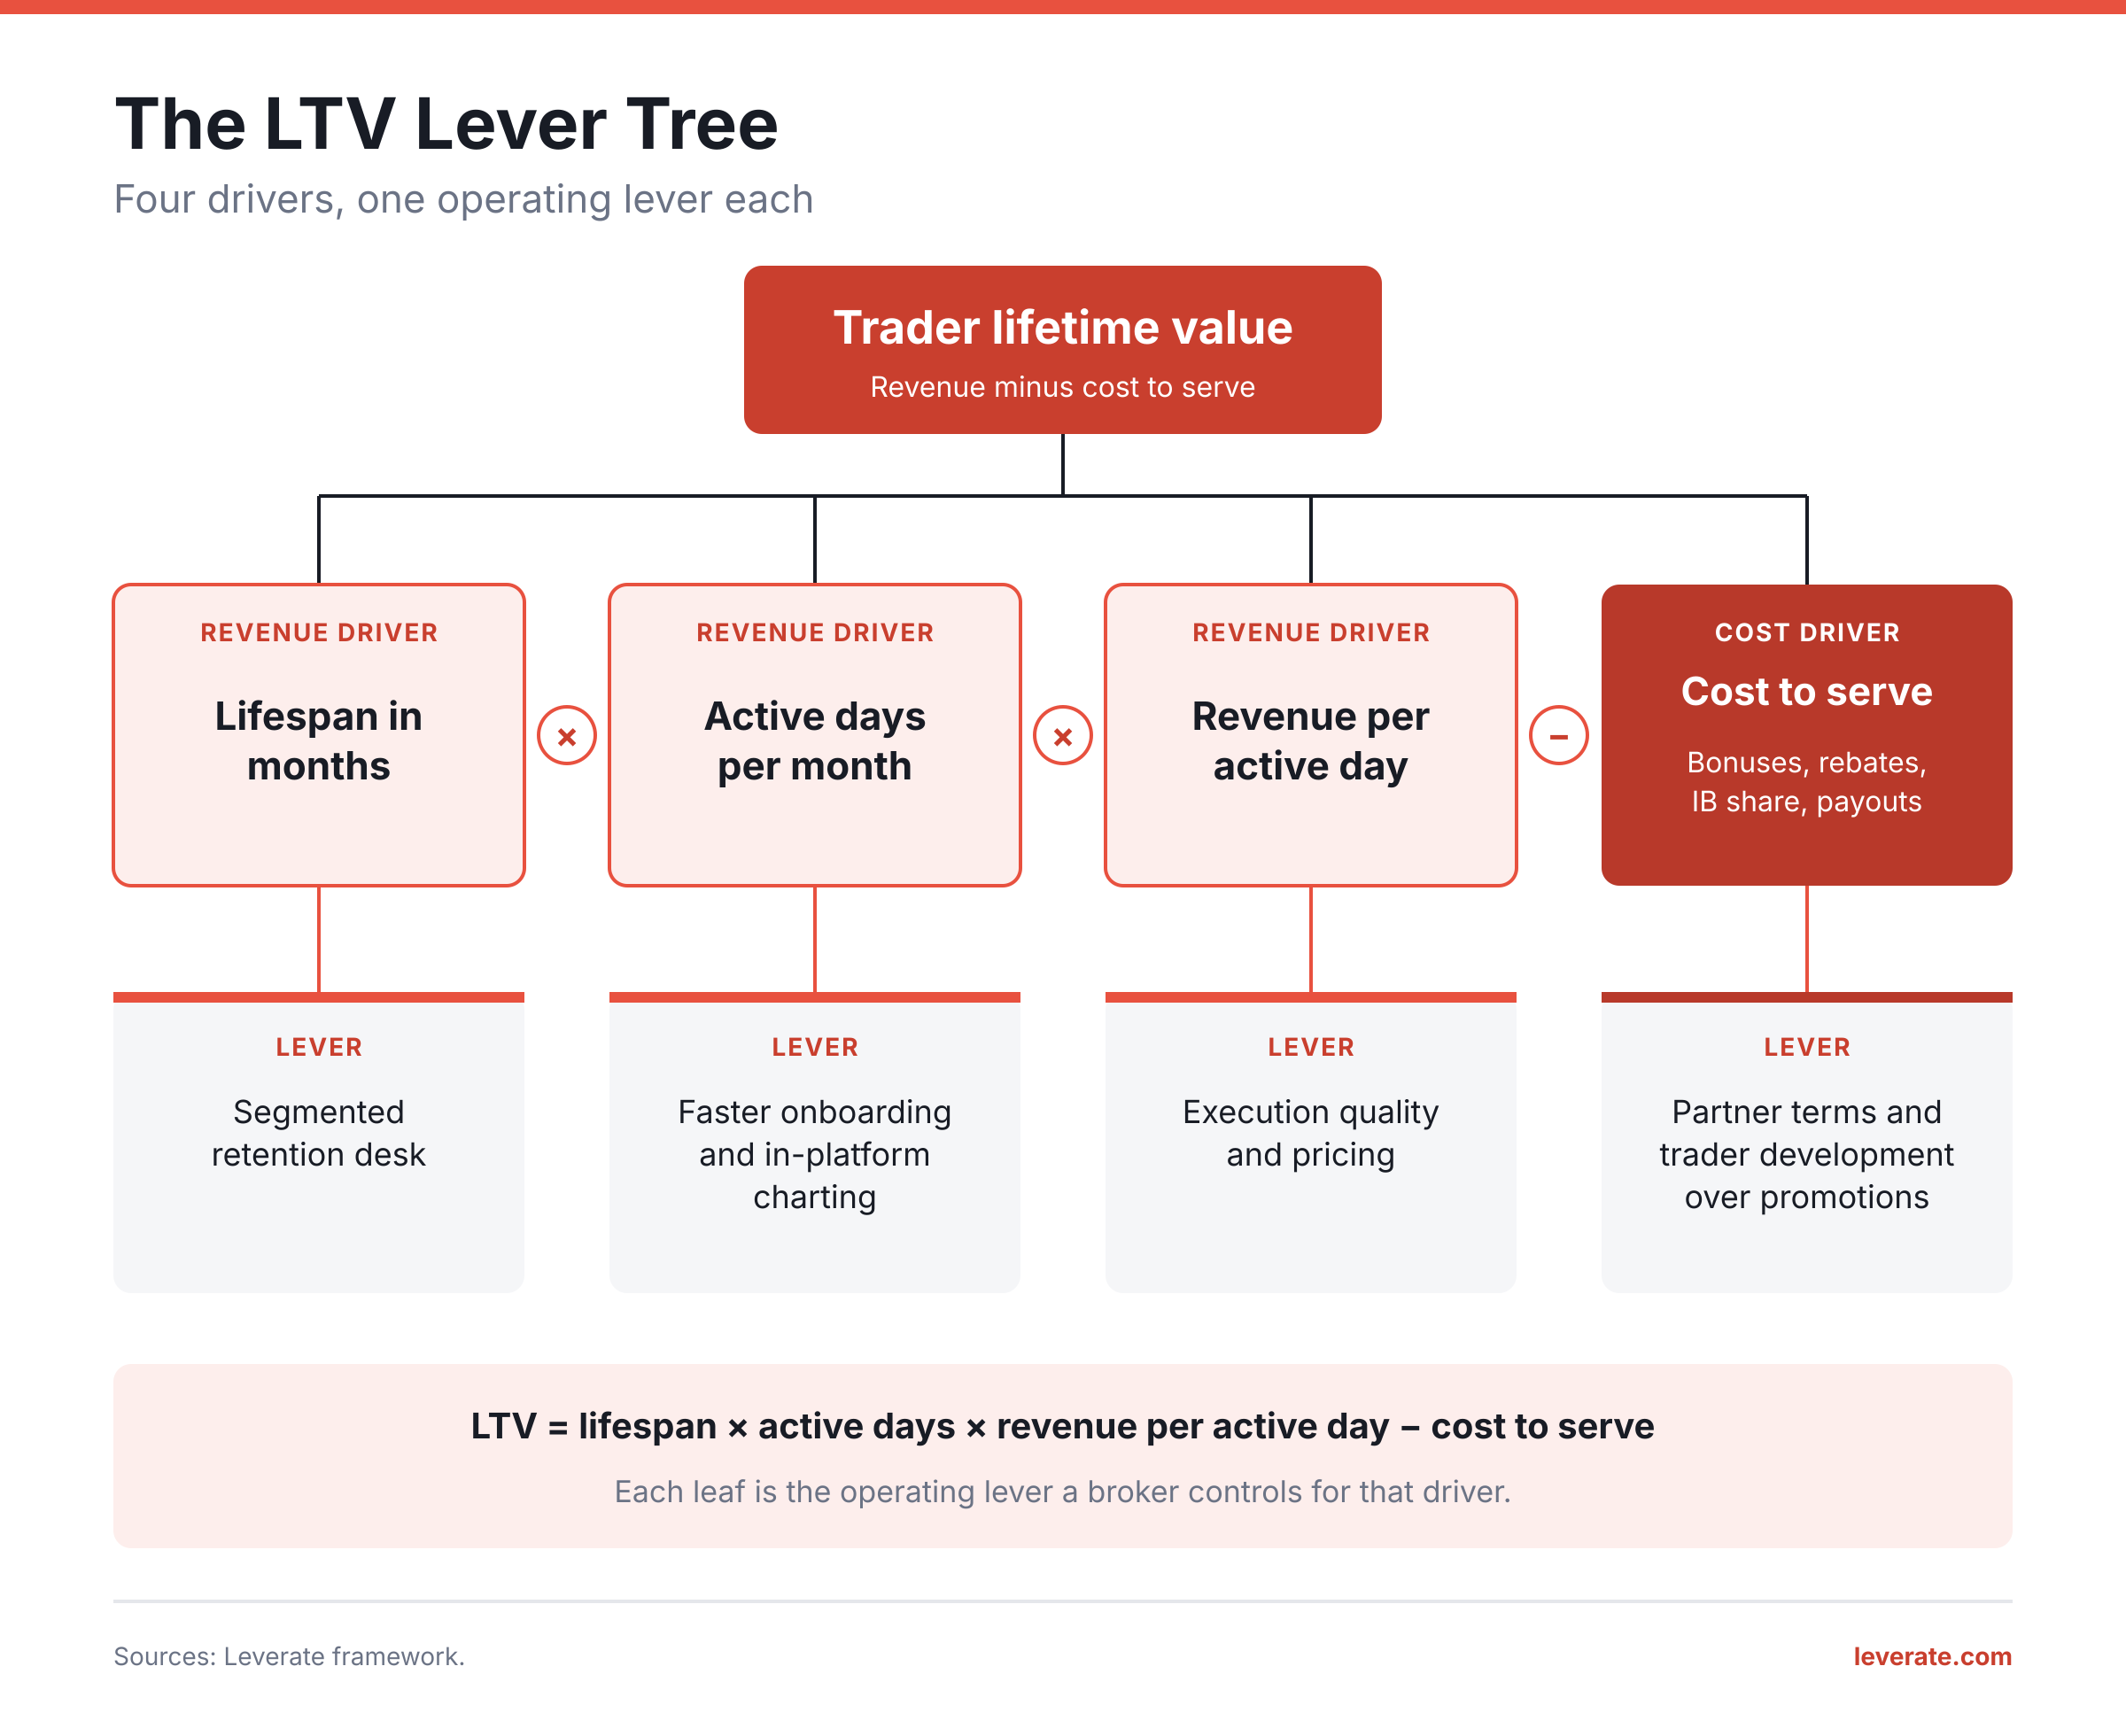
LTV = lifespan in months × active days per month × revenue per active day, minus cost to serve
Splitting revenue this way beats a single average, because each part maps to a team. Lifespan belongs to retention. Active days belong to engagement and platform experience. Revenue per active day depends on pricing, execution and the instruments clients trade. Cost to serve sits with finance and partnerships.
Here is a quick illustration with made-up inputs, not benchmarks. A trader active for 8 months, trading on 10 days a month and generating $25 per active day produces $2,000. Take away $400 of cost to serve and the LTV is $1,600. Replace every input with your own cohort data before drawing conclusions.
These inputs only become reliable when trade and payment records live in one place. Leverate's Back Office for brokerages brings trading activity, payments and client records together, so revenue and cost can be matched per trader instead of rebuilt in spreadsheets each month.
Adjusting the formula for your revenue model
The revenue and cost lines change with how the business earns money. Use the version that fits your model.
| Revenue model | Revenue line | Cost line | Main driver |
|---|---|---|---|
| Agency (commission or markup) | Commissions and spread markup on client volume | Liquidity costs, payment fees, partner share | Trading volume per active day |
| Hybrid execution | Markup plus net result on internalised flow | Hedging costs, payment fees, partner share | Flow routing and risk management |
| Prop firm | Challenge fees and repurchases | Payouts to funded traders, platform and data fees | Repurchase rate and payout ratio |
Hybrid models need extra care. Revenue from internalised flow swings with client results, so one strong or weak month can distort a cohort. Use rolling averages across several months before acting on the number.
Read LTV by Cohort, Not by Average
A blended average of trader lifetime value across every client hides what is changing. Cohort retention analysis groups clients who started in the same month and follows each group over time. You can see whether newer clients stay longer than older ones, and whether a pricing or onboarding change actually moved behaviour.
Cohorts also protect you from market noise. The BIS Triennial Survey for 2025 put average OTC FX turnover at a record $9.6 trillion a day in April 2025, up 28% on three years earlier. A Banque de France review of the survey results links that jump to the US tariff announcements made the same month.
The lesson for operators is direct. A cohort that started in a volatile month will look strong on early revenue, because everyone traded more. Compare it with other cohorts at the same age and check whether its lead lasts once markets calm. If the advantage fades by month three, the gain came from the market, not from your retention work.
Cut each cohort by acquisition channel and region as well. A paid social cohort and an IB cohort from the same month rarely behave alike, and a blended view hides which one is carrying the result.
Early Signals of a High-Value Trader
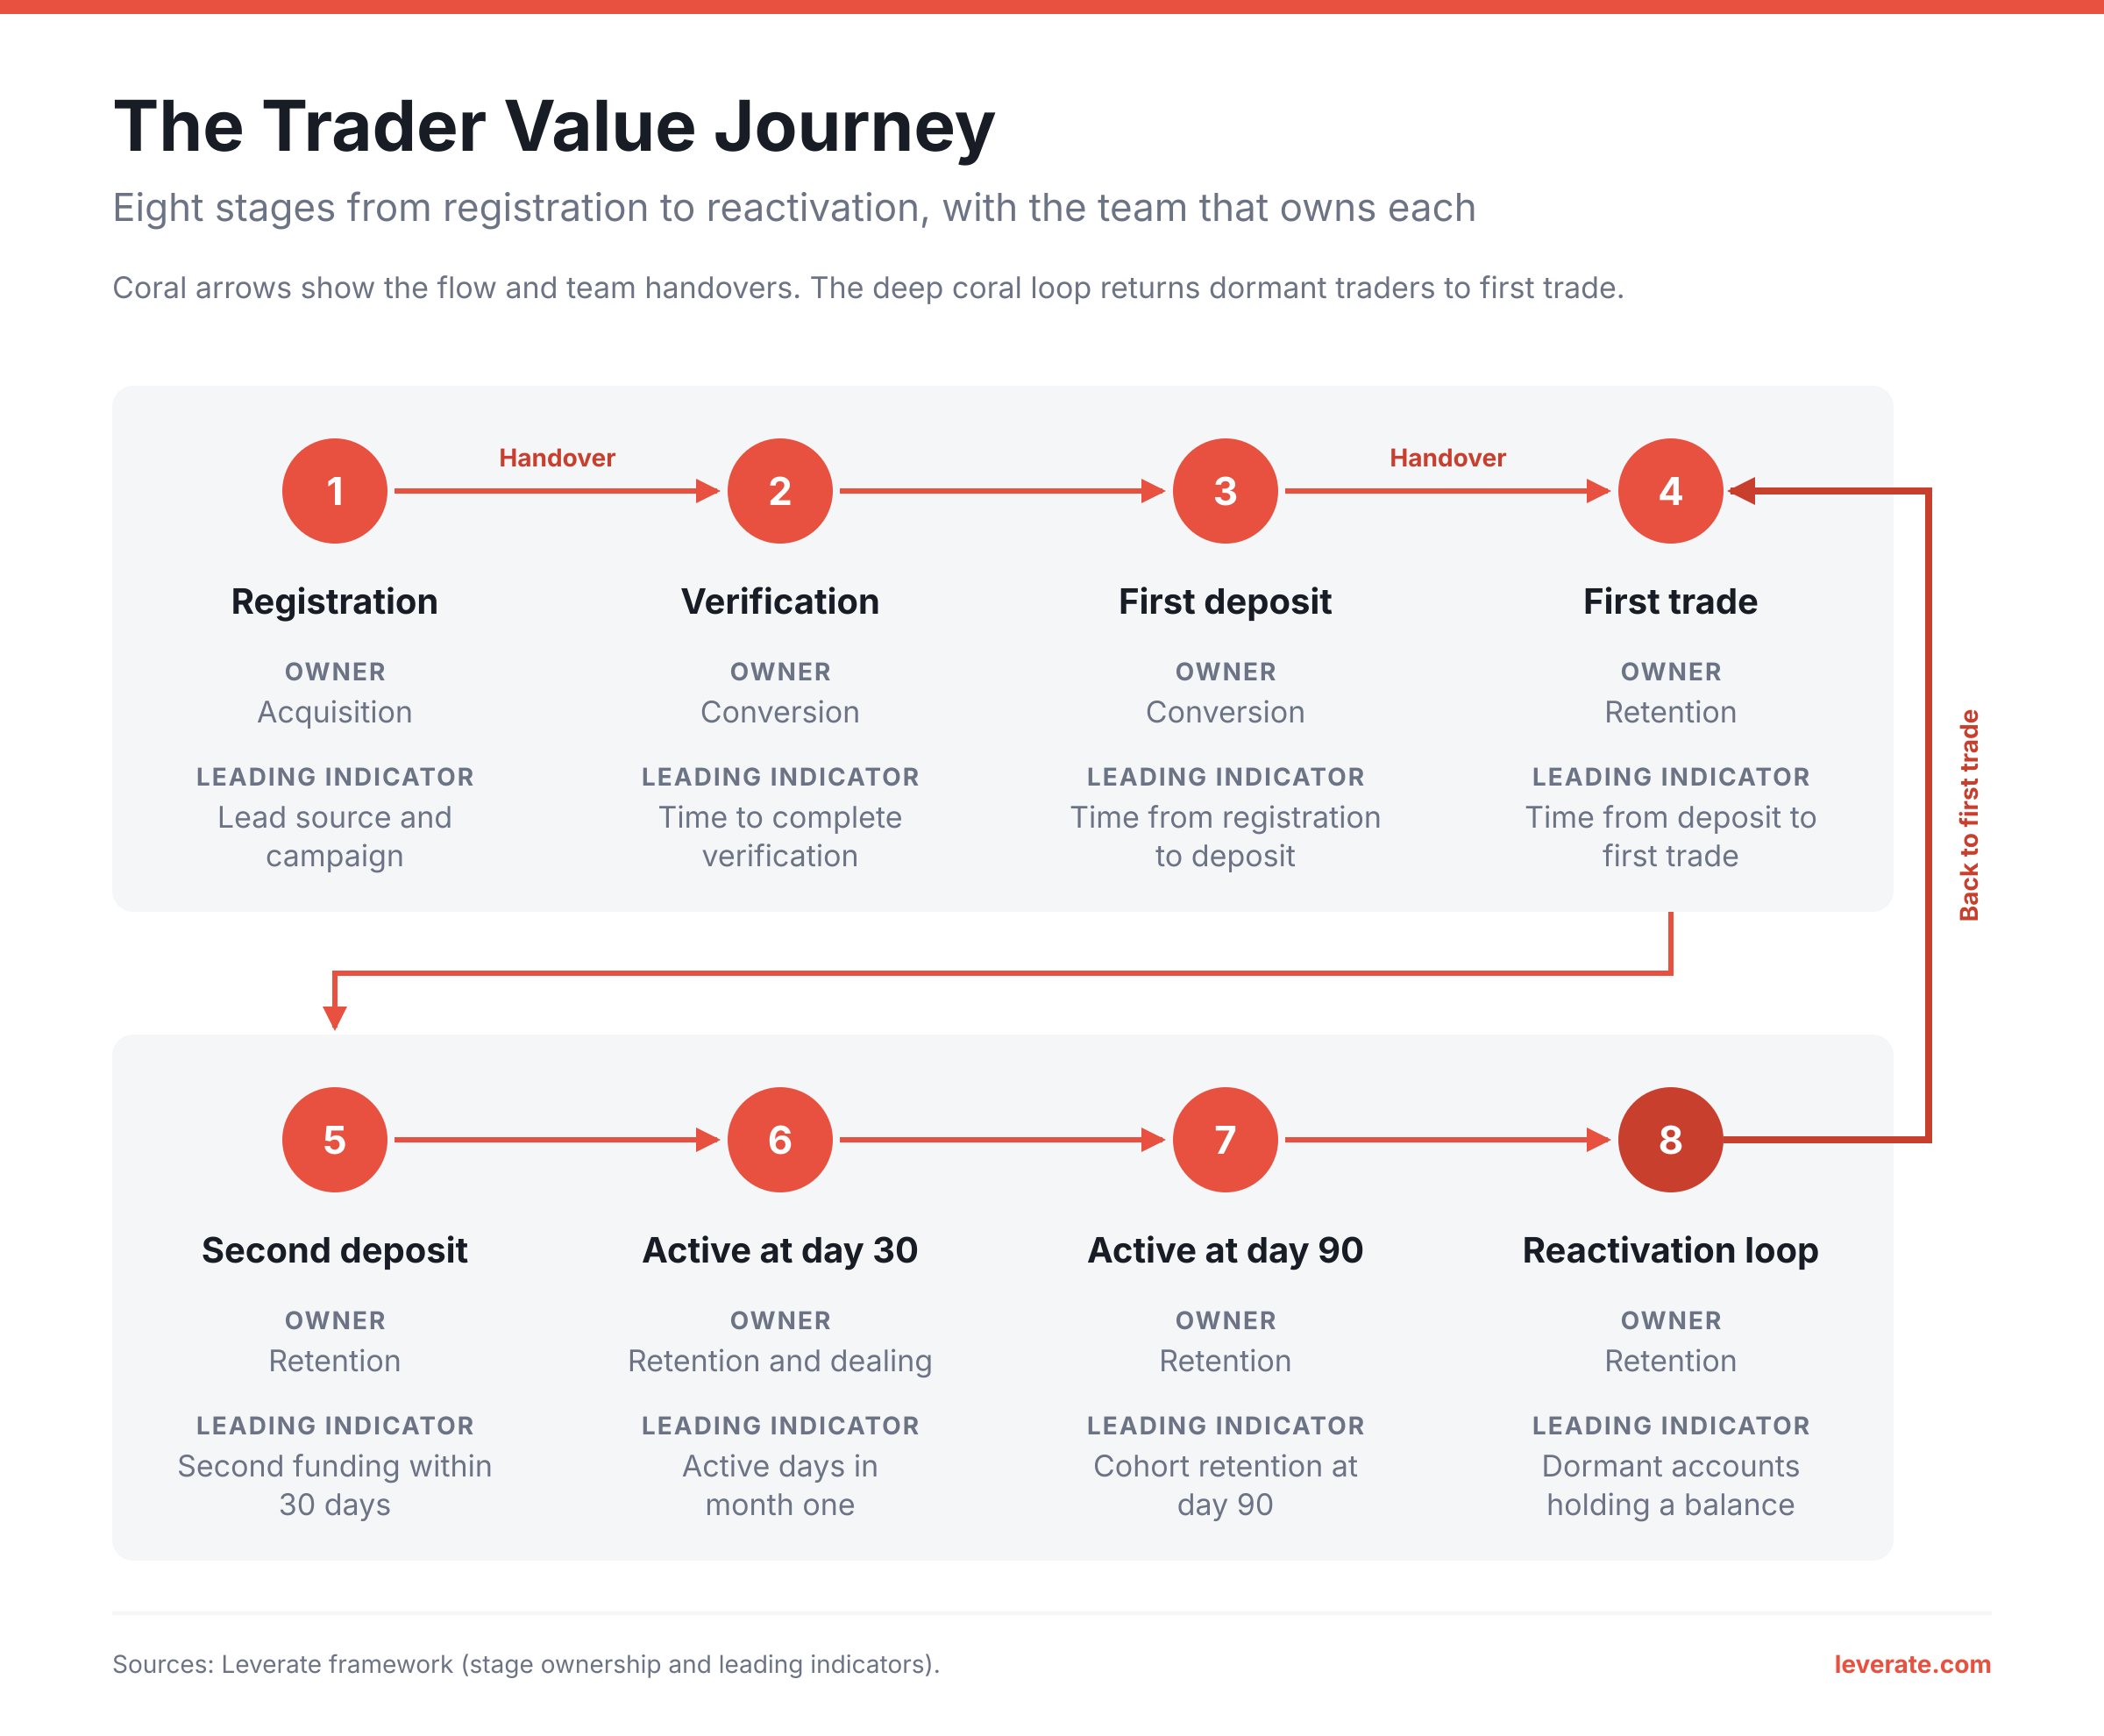
Lifetime value takes months to show in full, but the first 30 days carry strong clues. Track these leading indicators for every new depositor:
- Time from deposit to first trade. A long gap is often the first sign of an account that never activates.
- A second deposit. Funding again is one of the clearest signs that a client plans to stay.
- Active days in month one. How often a client trades says more than the size of their first position.
- Instruments traded. Clients who explore more than one market tend to build a broader trading habit.
- Platform sessions. Logins, chart views and watchlist activity show interest even on days without trades.
Each signal sits at a stage of the trader journey, and each stage has a team that owns it. The flow below maps those stages and handovers, from registration through to reactivation.
Acting on these signals needs a CRM that turns them into tasks. A Forex CRM can flag a client who funded but has not traded, or one who traded heavily for two weeks and then went quiet, and route them to the right agent. Our complete guide to Forex CRM software explains how these workflows are set up. The Client Portal plays a part too: when deposits, documents and account details sit in one clear place, fewer clients stall between registration and their first trade.
Five Levers to Grow Trader Lifetime Value
Every lever acts on one branch of the formula. The tree below shows where each one applies.
1. Faster onboarding and first trade
The shorter the path from deposit to first position, the more traders activate. Leverate's white-label trading platform gives clients a trading environment under the broker's own brand, and xChart adds charting tools inside it, so new clients can analyse and trade without leaving the broker's environment.
2. A segmented retention desk
Not every trader needs the same contact. Split clients by value tier and activity, then set different service levels. High-value clients get a named account manager. Mid-tier clients get timely, relevant market content. Low-activity clients get automated nudges. A Forex CRM keeps these segments live rather than static lists.
3. Execution quality and pricing
Revenue per active day depends on clients trading with confidence. Slippage and wide spreads during busy markets push active traders elsewhere. Leverate Prime liquidity sits behind the platform, helping brokers keep pricing and fills consistent when activity spikes.
4. Referral and partner channels
Clients who arrive through partners can behave very differently from paid traffic, and partners paid on retained clients have a reason to support them. Leverate's affiliate and IB management tools let brokers track partner-sourced clients and their activity, which is what makes channel-level value tracking possible.
5. Trader development over promotions
Promotions buy activity for a few weeks. Education, market insight and better tools build the habit that keeps a trader active for years. Keeping clients also pays: Bain research reported in Harvard Business Review's 2014 article on keeping the right customers found that winning a new customer costs 5 to 25 times more than keeping one, and that a 5% rise in retention can lift profits by 25% to 95%.
Trader Lifetime Value for Prop Firms
Prop firms earn differently, so the formula shifts. Lifespan is better counted in challenge attempts than in months. A trader who fails, buys again and eventually passes may be worth more than one who passes first time and moves straight to payouts.
Three numbers drive value for a prop firm:
- Repurchase rate. The share of traders who buy another challenge after a failed attempt.
- Pass-to-funded rate. The share of challenges that end in a funded account.
- Payout ratio. Payouts to funded traders as a share of fee revenue from the same cohort.
Payouts are the main cost to serve, so they must sit in the same cohort view as fees. A cohort that looks profitable on fees alone can turn negative once its funded traders start drawing profits. Leverate's PROP CRM for prop firms keeps challenges, accounts and payouts side by side, so firms can watch that balance cohort by cohort.
Using LTV to Set Acquisition Budgets
Lifetime value earns its keep when you set it against acquisition cost. The broker LTV to CAC ratio shows how much value each dollar of acquisition returns. Client acquisition cost in forex varies widely by channel and region, and it tends to rise as a channel is pushed harder, so read the ratio per channel rather than for the whole business.
Subscription businesses often work to a fixed target ratio, but no single target fits every brokerage. Payback period is often more practical: the number of months of cohort revenue needed to recover what the cohort cost to acquire. Use this decision path for each channel:
- If payback beats your target and early signals hold, raise the budget in steps.
- If payback is on target but cohort retention is slipping, hold spend and fix onboarding first.
- If payback misses the target and early signals are weak, cut spend or renegotiate partner terms.
- If a channel is too new to judge, cap its budget until its first cohorts mature.
Running trader lifetime value through this path stops a team from scaling a channel that looks cheap at signup but loses its clients within weeks.
The Bottom Line
Trader lifetime value is the clearest test of whether a brokerage is building a lasting client base or renting one month by month. It turns retention, platform and pricing work from soft goals into figures that finance can weigh directly against marketing spend. The operators who gain most treat it as a shared metric that every team moves, not a report marketing runs once a quarter. To see how your own figures stack up, try the broker benchmark calculator, or book a demo to see how Leverate's Forex CRM and Back Office reporting supply the cohort data behind it.
Disclaimer: This content is based on multiple sources and is provided for educational purposes only. It does not constitute financial, legal, or investment advice.